Is Biking Greener than Driving? Study Insights
When faced with the choice between pedaling and pressing the gas pedal, most people consider convenience over environmental impact. However, scientific research reveals a compelling story: biking substantially outperforms driving in terms of carbon footprint, energy efficiency, and ecological sustainability. This comprehensive analysis examines peer-reviewed studies, lifecycle assessments, and real-world data to answer the question that increasingly concerns environmentally conscious commuters: just how much greener is biking than driving?
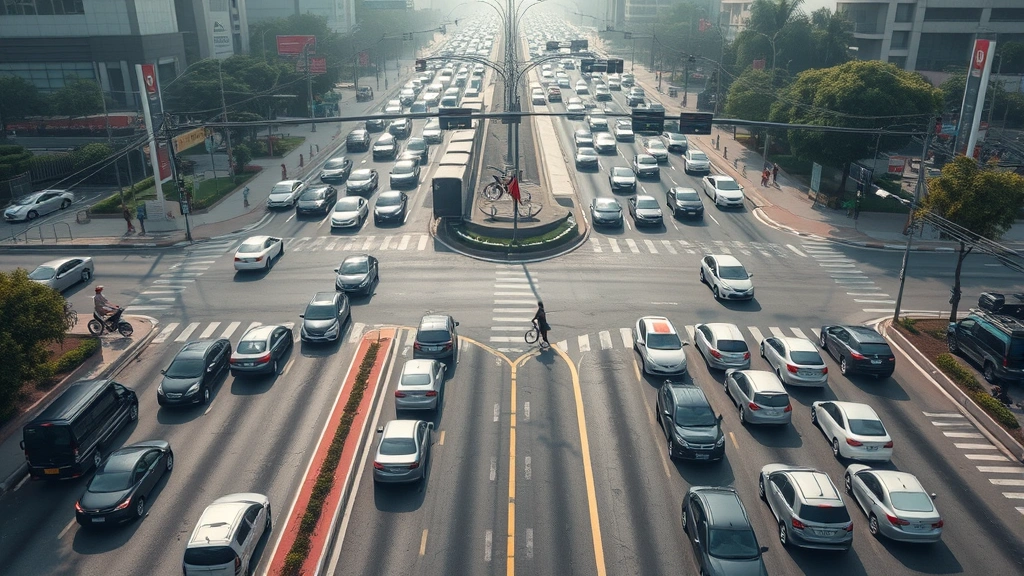
The transportation sector accounts for approximately 27% of global greenhouse gas emissions, with personal vehicles contributing the lion’s share. Meanwhile, bicycles remain one of humanity’s most efficient machines—requiring no fuel, producing zero emissions, and delivering remarkable health benefits. Understanding the quantifiable differences between these two modes of transportation empowers individuals to make informed decisions about their commuting habits and their carbon footprint.
Carbon Emissions: The Core Comparison
Recent studies demonstrate that a single car journey produces dramatically more carbon dioxide than the same trip by bicycle. According to research published by the U.S. Environmental Protection Agency (EPA), the average passenger vehicle emits approximately 4.6 metric tons of CO₂ annually. In contrast, a bicycle produces zero direct emissions throughout its operational lifetime.
When examining specific trip data, a 10-mile commute by car generates roughly 2.4 kilograms of CO₂, while the same journey by bicycle produces zero emissions during travel. Even when accounting for the embodied carbon in bicycle manufacturing—approximately 61 kilograms of CO₂ equivalent for a typical aluminum frame bike—the payback period is remarkably brief. Studies indicate that a bicycle offsets its manufacturing emissions within the first 100 to 300 kilometers of use, after which every pedal stroke represents net environmental gain.
The comparison becomes even starker when examining multi-passenger vehicles. A car carrying five people reduces per-person emissions to roughly 480 grams of CO₂ per 10 miles, still significantly higher than cycling’s zero emissions. This disparity underscores why urban planners increasingly prioritize sustainable energy solutions that encourage alternative transportation modes.
Energy Efficiency Analysis
Energy efficiency measurements reveal the dramatic superiority of human-powered transportation. Bicycles convert approximately 90% of human energy input into forward motion, making them the most efficient transportation mode ever engineered. By comparison, internal combustion engines convert only 12-30% of fuel energy into actual vehicle movement, with the remainder lost as heat and friction.
This efficiency gap translates into tangible resource consumption. A car traveling 25 miles per gallon expends approximately 0.04 gallons per mile, while a cyclist expends roughly 35 calories per mile—equivalent to 0.0015 kilowatt-hours of energy. When comparing caloric intake to fuel consumption, a person would need to eat significantly more food to match the energy efficiency advantage of cycling over driving. The human body, operating on renewable biological energy, dramatically outperforms petroleum-dependent engines.
Furthermore, manufacturing fuel represents a substantial hidden energy cost. Extracting, refining, and transporting gasoline requires significant energy investment before it even enters a vehicle’s tank. Bicycles, by contrast, require no fuel infrastructure, eliminating this upstream energy burden entirely. For those interested in understanding broader energy comparisons, exploring natural gas versus propane considerations reveals how even alternative fuels require substantial energy investment.

Lifecycle Environmental Impact
Comprehensive lifecycle assessments examine environmental impact across an entire product’s lifespan—from raw material extraction through manufacturing, transportation, use, and eventual disposal. When conducting such analysis, bicycles demonstrate overwhelming environmental advantages despite their manufacturing footprint.
A typical car’s lifecycle generates approximately 61 tons of CO₂ equivalent over its 150,000-mile lifespan, accounting for manufacturing (8-10 tons), fuel consumption (40-45 tons), maintenance (2-3 tons), and end-of-life recycling. A bicycle’s complete lifecycle generates merely 0.5 to 1 ton of CO₂ equivalent—roughly 60 times lower than automobiles. This calculation assumes average vehicle usage patterns and includes the bike’s manufacturing, maintenance, and eventual recycling.
Material sourcing compounds the environmental difference. Car manufacturing requires extensive mining for steel, aluminum, and rare earth elements, consuming vast quantities of water and energy while generating significant mining waste. Bicycle manufacturing, while still requiring material extraction, demands substantially fewer raw materials. An average car weighs 4,000 pounds; a bicycle weighs 25-35 pounds. This 100-fold weight difference directly correlates to reduced resource consumption and environmental impact.
Water consumption presents another critical dimension. Manufacturing a single car requires approximately 39,000 gallons of water, while bicycle production uses roughly 400 gallons. Over a vehicle’s lifetime, these water demands accumulate substantially, particularly concerning in water-scarce regions. For comprehensive understanding of resource consumption, reviewing whether natural gas is renewable provides context for alternative fuel’s limitations.
Health and Social Benefits
Beyond environmental metrics, cycling delivers substantial health benefits that amplify its sustainability advantage. Regular cycling reduces obesity, cardiovascular disease, and mental health disorders—healthcare benefits worth approximately $3,000 to $5,000 per person annually in reduced medical costs. These health improvements represent environmental gains through reduced pharmaceutical manufacturing, hospital energy consumption, and medical waste generation.
Cycling also reduces traffic congestion, which paradoxically increases automobile emissions. Congested driving generates approximately 25% more emissions than free-flowing traffic due to inefficient fuel consumption during stop-and-go patterns. Every cyclist removed from traffic reduces congestion-related emissions for remaining drivers, creating a positive externality that benefits entire communities.
Social cohesion strengthens in communities prioritizing cycling infrastructure. Neighborhoods with robust bike lanes experience increased social interaction, stronger community bonds, and reduced crime rates. These social benefits, while difficult to quantify environmentally, represent sustainability’s broader human dimension—creating livable communities where people thrive alongside nature rather than dominating it.
Infrastructure and Urban Planning
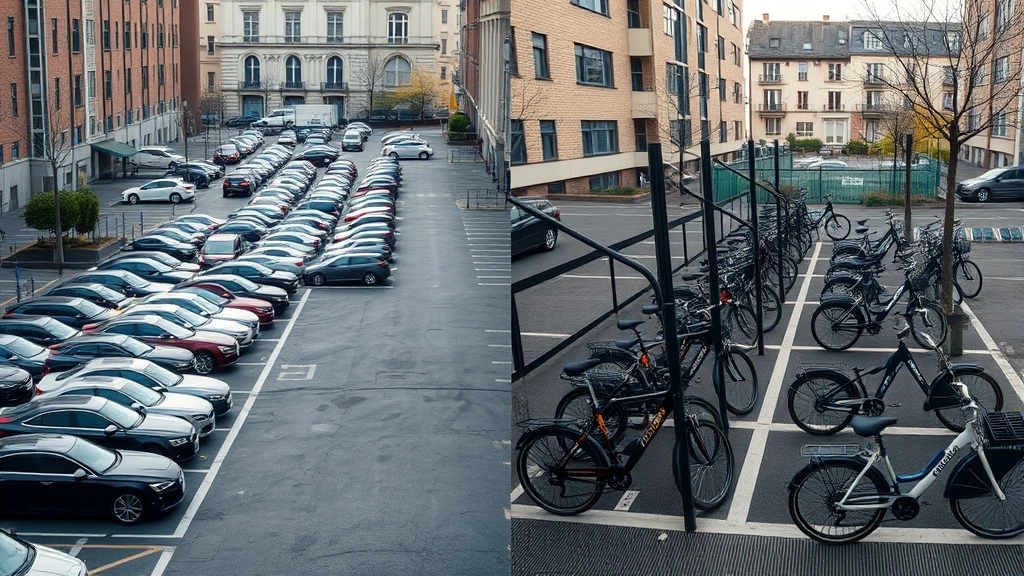
The environmental comparison extends beyond individual trips to encompass infrastructure requirements. Roads and parking for automobiles consume vast land areas—approximately 14% of urban land in American cities serves parking alone. This land consumption drives habitat destruction, increases stormwater runoff, and reduces urban green space critical for air quality and temperature regulation.
Bicycle infrastructure requires dramatically less space. A single parking space accommodates 8-10 bicycles, while consuming far less concrete and material. Protected bike lanes occupy similar road width as car lanes but transport 5-10 times more people per hour, making them far more efficient land utilization. Cities implementing comprehensive cycling networks reduce overall transportation infrastructure environmental impact significantly.
Road maintenance presents another environmental consideration. Heavier vehicles cause accelerated pavement degradation, requiring frequent repairs consuming fuel, materials, and labor. Bicycles cause negligible road wear, reducing maintenance frequency and associated environmental costs. Cities like Copenhagen and Amsterdam, which prioritized cycling infrastructure decades ago, now benefit from reduced road maintenance expenses and environmental impact.
Practical Considerations for Commuters
While biking’s environmental superiority is clear, practical factors influence adoption rates. Weather, distance, physical ability, and infrastructure availability affect whether cycling remains feasible for individual commuters. Understanding these considerations enables more nuanced environmental decision-making.
Weather presents the most commonly cited barrier. Research indicates that precipitation reduces cycling trips by 50-80%, while temperature extremes similarly discourage pedaling. However, cities with excellent cycling infrastructure maintain high ridership despite adverse weather—Dutch cyclists average 2.5 trips daily even during winter months, demonstrating that infrastructure investment overcomes weather concerns.
Distance limitations affect feasibility more significantly. Most cyclists comfortably travel 3-5 miles for commuting; trips exceeding 10 miles become challenging for average commuters. This limitation explains why e-bikes represent a crucial sustainability innovation—electric-assist bicycles extend practical cycling range to 20-30 miles while reducing physical exertion barriers. Exploring advantages of electric vehicles provides context for how electrification benefits multiple transportation modes.
Accessibility concerns require acknowledging that not everyone can cycle due to physical disabilities, age, or health conditions. Sustainable transportation solutions must accommodate diverse needs through multimodal systems combining cycling, public transit, and accessible vehicles. Dismissing driving entirely ignores legitimate accessibility requirements that make personal transportation necessary for certain populations.
The Role of Electric Vehicles
Electric vehicles represent an important intermediate solution in the transition from petroleum-dependent driving toward sustainable transportation. While EVs produce zero tailpipe emissions, their lifecycle environmental impact depends heavily on electrical grid composition. In regions powered primarily by renewable energy, EVs approach bicycles in environmental performance; in coal-dependent grids, EVs produce roughly 50% fewer emissions than conventional cars but remain substantially higher than cycling.
The most sustainable transportation approach combines cycling for short distances, public transit for medium distances, and electric vehicles for longer trips or accessibility needs. This multimodal strategy acknowledges diverse commuting requirements while maximizing environmental benefits. Cities implementing comprehensive green technology innovations increasingly emphasize this integrated approach.
Battery production for electric vehicles, while necessary, generates significant environmental impact through mining lithium, cobalt, and other minerals. Batteries require 61-106 kilograms of CO₂ equivalent per kilowatt-hour of capacity for production. However, over a vehicle’s lifetime, EVs typically offset manufacturing emissions within 1-3 years of operation, particularly in regions with cleaner electrical grids. This comparison demonstrates that while EVs improve upon conventional vehicles, bicycles remain categorically superior from environmental perspectives.
FAQ
How much carbon does one person save annually by biking instead of driving?
An average commuter switching from driving to cycling saves approximately 2.5 to 3.5 metric tons of CO₂ annually, assuming a 10-mile round trip commute five days weekly. This figure varies based on vehicle efficiency, driving patterns, and electricity grid composition for charging alternatives. For perspective, this annual savings equals the carbon sequestered by roughly 40-50 tree seedlings grown for 10 years.
What about bicycle manufacturing emissions?
A typical aluminum bicycle generates approximately 61 kilograms of CO₂ equivalent during manufacturing. This embodied carbon is offset within 100-300 kilometers of cycling, typically accomplished within 2-4 weeks of regular commuting. Over a bicycle’s 10-year lifespan covering 15,000-20,000 kilometers, manufacturing represents less than 1% of total environmental impact when compared to equivalent car journeys.
Can electric bikes match bicycles’ environmental benefits?
E-bikes produce minimal emissions during operation if charged from renewable energy sources. Their batteries generate 2-4 kilograms of CO₂ equivalent during manufacturing, offset within 1,000-2,000 kilometers of use. Over their lifespan, e-bikes remain substantially cleaner than cars while extending cycling’s practical range, making them excellent sustainable transportation options for longer commutes or physically demanding terrain.
How do weather and infrastructure affect cycling adoption?
Protected cycling infrastructure and winter maintenance increase ridership by 30-50% in temperate climates. Cities investing in comprehensive bike networks, weather protection, and maintenance see sustained high ridership regardless of seasonal conditions. The Netherlands maintains 27% cycling mode share despite winter weather, demonstrating that infrastructure commitment overcomes environmental barriers.
What about multimodal transportation combining biking and driving?
Combining cycling with occasional car use for longer distances or adverse weather remains substantially cleaner than exclusive driving. Cycling 80% of commutes while driving 20% reduces annual emissions by approximately 2 metric tons compared to exclusive driving. Bike-and-ride programs combining cycling to transit stations with public transportation multiply environmental benefits while maintaining practical flexibility.
How do bicycles compare to public transportation?
Public transit produces roughly 0.14 kilograms of CO₂ per passenger-mile—dramatically cleaner than cars but slightly higher than bicycles when accounting for fuel consumption and passenger loads. However, public transit enables transportation for longer distances and greater passenger volumes than cycling alone. Optimal sustainability combines cycling for short trips with public transit for longer distances, creating comprehensive low-carbon mobility systems.
Are there environmental costs to cycling infrastructure?
Protected bike lanes require concrete and materials generating approximately 0.5-1 ton of CO₂ per 100 meters of installation. However, these infrastructure emissions are offset within 1-2 years through reduced car trips and congestion. Over 20-30 year infrastructure lifespans, the environmental benefits of cycling networks dramatically exceed installation impacts, particularly in high-traffic corridors.